Clustering and Segmentation
The Thesis
Organizations can better develop population segments by building clusters through a Naïve Bayes Therom. This is compared to common strategies that create personas based on arbitrary and sometimes biased decisions. These newly developed segments will better identify which data points affect conversion rates and which values in those data points make users more or less likely to convert.
The Method
The cluster analysis we will be reviewing in this article is that of comparing user demographic data to whether or not they completed a specific conversion event. Any user data, behavioral or demographic, can be utilized to better understand variable features and how they affect specific conversion rates. In general, it is best practice to review multiple different conversion types in order to find consistency across the board and to highlight key differences within your population’s conversions. Multidimensional conversion analysis is beyond the scope of this article.
Setting up your data
When developing your initial clusters, it is best to simplify the data as we have below. For example, creating a different value for every possible income value would give incredibly specific information, but it would be far less usable at a practical level. In this case, our five features with 2-3 values already produce 108 different clusters.
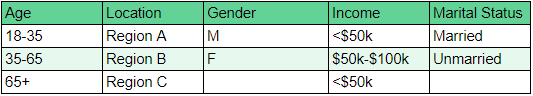
In this case, if we were to add even one more value option to each of the five features, we would jump to 576 clusters.
Once we know our different features, we then need to create a matrix of all our users with their features and whether or not they converted. This matrix has been built in a Google Sheet to help visualize.
Once that is complete, we then need to run the actual Bayes Therom to understand the probability of any new user converting based on their feature information (demographics)
The following section is a simplified explanation of the math that determines probability.
P(Convert X | Customer A), which can be read as “The probability of conversion given customer A,” which means: “The probability someone with the exact features of Customer A will convert.”
Using a Bayes Therom, the equation can be rewritten as
P(X | A) = [P(X) * P(A | X)] / [P(X)*P(A | X) + P(not_X)*P(A | not_X)]
P(A | X) and P(A | not_X) are the products of each feature held by user A, given whether they converted (X) or not (not_X). A list of the probability that a user has a specific feature given whether or not they converted can be found here.
Grouping your users and creating segments
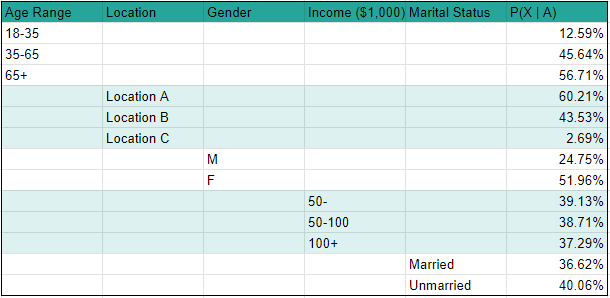
When analyzing our data, we want to look for features that significantly affect whether or not a user will convert. In this case, we see substantial effects from age, location, and gender, with minimal effects from income and marital status. We know this because of the range in probability for each feature. A wider range means a feature’s different values have more impact on the chances of converting. As you can see in image 2, age shows only a 2-point range in conversion rate, whereas location shows a 58-point range.
We can use these relative ranges to rank our features and create a decision tree in order of importance. This will allow you to minimize the work required by your system. For example, whether or not a user is married is minimally influential in whether or not a user converts. Therefore, it should be put last in this decision tree.
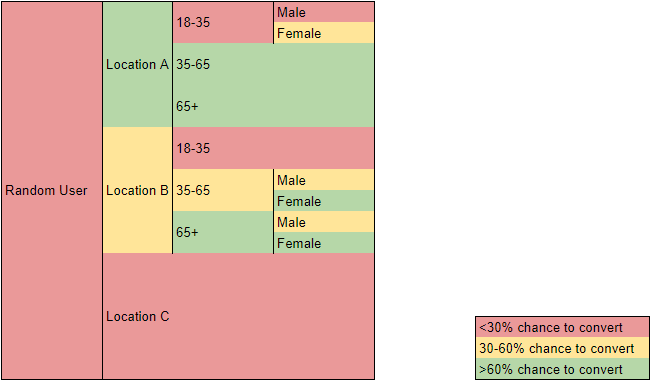
A complete visualization of our decision tree, with associated probabilities, can be found here. However, developing a system that calculates the probability of whether every new user will convert would be incredibly resource-intensive. Instead, we can simplify the system by creating distinct groupings of probabilities. An example follows.
Group 1 (Green) is the most likely to convert and will be defined by people with a 60% or greater chance of converting.
Group 2 (Yellow) will possibly convert and will be marked by people with a 30-60% chance of converting.
Group 3 (Red) will unlikely convert with a conversion chance below 30%.
With this simplified decision tree, you can begin to focus on which user features are most telling when it comes to conversion. It can also drastically reduce the resources your physical staff and systems need to execute impactful work. Examples include purchasing a new lead list from only location A, focusing marketing efforts on mediums viewed by people 65+, avoiding strategies that target men 18-35, or from Location C.
We also now have very clear segments and user personas to target. Instead of developing personas based on things that we think may be important but in actuality are not, like marital status or income, we can develop them based on features that are important, like age and geographical location.
Related concepts
It is important to note that the potential gain from information like this is very hard to understate. Not only do we now see how our different users act, and what affects those decisions we can now much more accurately understand things like test results, or if used for sales teams lead quality.
For example let’s say we run a test to improve conversion rates and the result is only a 1 % lift. Normally you may think that a test like that is not large enough to matter. But by now having a better understanding of our audience we may see that it is actually a 10% lift for groups in red and was ineffective at moving the needle for groups in green and yellow.